Data Analyst Resume
Explore Data Analyst Resume with ResumeBuild. Use this resume example as a reference for your own experience, skills, and qualifications.





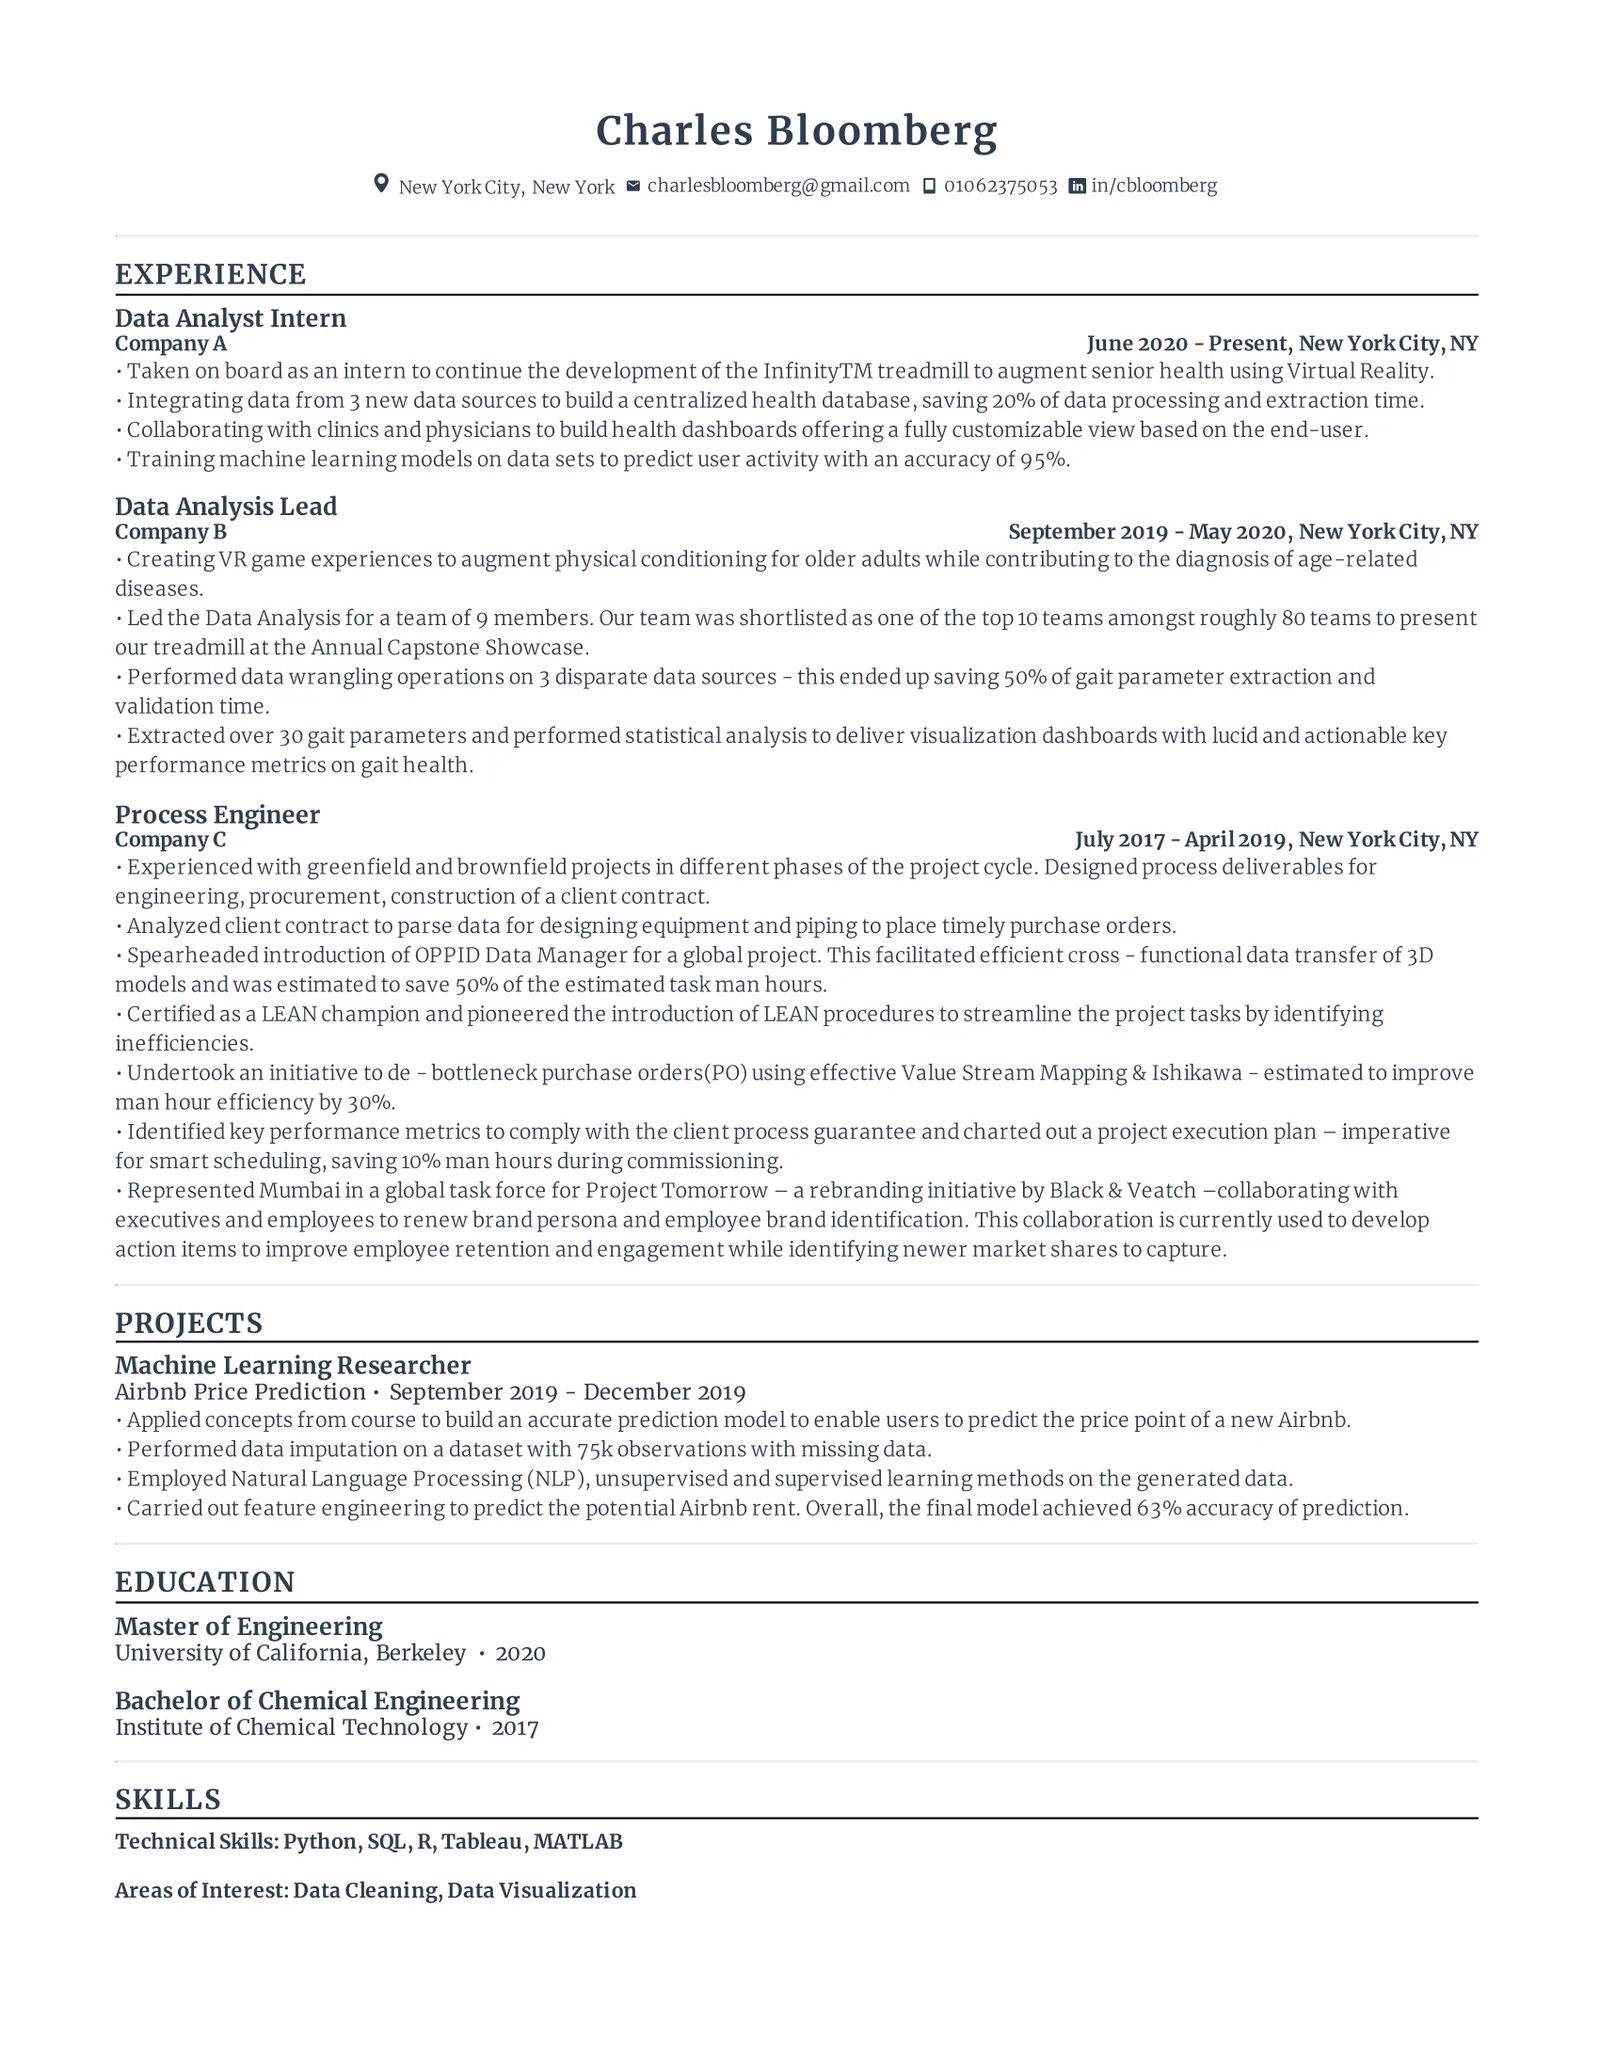
Below are six sample data analyst resumes in full text. The first two are the most detailed. One is for an entry-level applicant moving into analysis from another job, with a projects section. The other is for an experienced analyst who has been promoted and now mentors others. Four shorter examples follow for a recent graduate with a healthcare internship, a financial data analyst, a marketing data analyst and an analytics manager.
Each resume has the same core parts: contact information, a short summary, grouped technical and business skills, work experience bullets that name the tool and the result, a projects section when the applicant lacks an analyst title, and education and certifications. To write your own, pick the sample closest to your level or field, keep its section order, and replace each bullet with work you did, the tool you used and what changed. After the examples, the guide covers how to write each part. The names, employers and figures on this page are fictional.
Entry-level data analyst resume example with projects
Use this layout if you have the skills but not yet a data analyst job title. It works for recent graduates, certificate or bootcamp graduates, and people like Marcus, who has been using data in an operations job.
Start your own resume from a template.
Summary
Warehouse operations supervisor moving into data analysis after eight years of running shifts against daily targets. Completed the Google Data Analytics Professional Certificate and two portfolio projects in SQL, Python and Tableau. Built the Excel tracker Northfield Logistics still uses to find mis-picks by aisle and shift.
Skills
Technical: SQL (BigQuery, PostgreSQL), Excel (pivot tables, XLOOKUP, Power Query), Python (pandas, Matplotlib), Tableau
Business: KPI reporting, root-cause analysis, presenting results to frontline teams, process documentation
Projects
Citi Bike Morning Shortages | SQL (BigQuery), Tableau | 2026
- Asked which Jersey City docking stations run out of bikes before 9 a.m. on weekdays.
- Queried 2025 public trip records in BigQuery to compare departures and arrivals by station and hour.
- Published a Tableau Public dashboard ranking 20 stations by average morning shortfall, with a map and an hour-by-hour view: public.tableau.com/app/profile/marcus.bell
Online Retail Customer Segments | Python (pandas), Excel | 2025
- Asked which lapsed customers were worth targeting with a win-back offer.
- Cleaned a public dataset of about 540,000 online retail transactions, removing cancelled orders and rows without a customer ID.
- Grouped customers by recency, purchase frequency and spend, then wrote a one-page recommendation for a win-back email to lapsed high-value customers.
- Notebook and write-up: github.com/marcusbell/retail-segments
Experience
Operations Supervisor | Northfield Logistics, Columbus, OH | Mar 2020 – Present
- Built an Excel tracker with Power Query that combines daily pick-error and labor reports; the site manager uses it in the Monday operations meeting to assign retraining.
- Analyzed six months of mis-pick records by aisle and shift and traced 40% of errors to two aisles with worn location labels; after facilities relabeled them, mis-picks fell from 1.8% to 1.1% of orders the next quarter.
- Replaced a hand-copied end-of-shift report with a shared Excel template, saving each supervisor about 30 minutes per shift.
- Supervise 18 associates on second shift and train new shift leads to read the daily tracker.
Shift Lead | Northfield Logistics, Columbus, OH | Jun 2018 – Mar 2020
- Tracked hourly throughput against targets and reported staffing gaps to the operations supervisor.
Education
B.A. Economics | The Ohio State University | 2018
Certifications
Google Data Analytics Professional Certificate — Coursera, 2025
A few choices in this resume are easy to miss:
- Projects come before experience. They are the closest match to the job, so they sit where a hiring manager looks first. Each one states the question, the data, the tools and what came out of it, with a link the reviewer can open.
- The operations job keeps only its data work. Building the tracker, tracing the cause of mis-picks and replacing a manual report all show analysis. Supervising 18 people stays as one line because it shows he can explain numbers to a frontline team.
- The summary connects the two careers in one sentence. It states the move and the evidence for it without apologizing for the change.
Experienced data analyst resume example
This layout suits analysts with roughly five or more years of experience who own metrics, mentor others or report to leadership.
Start your own resume from a template.
Summary
Data analyst with seven years in subscription software and retail, working mainly in SQL, Python, dbt and Looker. Owns revenue and retention reporting at Corvus Software and built the churn-risk dashboard customer success uses to plan renewals. Mentors two junior analysts.
Skills
Technical: SQL (Snowflake, PostgreSQL), Python (pandas, statsmodels), dbt, Looker (LookML), Power BI (DAX), Excel, Git
Methods: cohort analysis, A/B test design and readout, time-series forecasting, regression
Business: metric definitions, requirements gathering, executive presentations, mentoring
Experience
Senior Data Analyst | Corvus Software, Denver, CO | Feb 2024 – Present
- Defined 14 core revenue and retention metrics in dbt and documented them in Looker, ending the conflicting churn figures that finance and customer success had been reporting separately.
- Built a churn-risk dashboard in Looker from product usage and support data; customer success reviews it weekly to prioritize renewal calls, and gross revenue retention rose from 88% to 92% over the following year.
- Set up the readout process for pricing-page A/B tests; the analysis of a billing-default test led the team to keep annual billing as the default, an estimated $310K in added annual bookings.
- Automated the monthly board metrics pack with Python and scheduled Snowflake tasks, cutting preparation from three days to half a day.
- Mentor two junior analysts and review their SQL and dashboards before release.
Data Analyst | Corvus Software, Denver, CO | Jun 2021 – Feb 2024 (promoted)
- Rebuilt the sales pipeline report in Looker; 45 account executives use it as their weekly forecast view, replacing three spreadsheet versions.
- Joined billing and CRM data in SQL to create the first customer-level revenue table, which finance uses for monthly revenue reconciliation.
- Analyzed trial sign-up funnels with product managers and presented the largest drop-off points at quarterly planning.
Associate Data Analyst | Meridian Home Goods, Chicago, IL | Jul 2019 – May 2021
- Built Power BI sales and inventory reports for 60 store managers, refreshed daily.
- Analyzed sell-through for slow-moving products and recommended lower reorder quantities for 120 SKUs, reducing end-of-season overstock by about $180K.
Education
B.S. Statistics | University of Colorado Boulder | 2019
Certifications
Microsoft Certified: Power BI Data Analyst Associate (PL-300) — earned 2022, renewed 2026
What changes at this level:
- Promotions are listed as separate titles. Data Analyst and Senior Data Analyst at Corvus each get their own dates, so the hiring manager sees the progression without working it out.
- Bullets describe ownership. Elena defined the metrics, set up the test readout process and reviews other analysts' work. Each result is a number the business already tracks: retention, bookings and reporting time.
- Older work gets less space. The retail job from 2019 has two bullets, enough to show where her BI reporting experience came from.
More data analyst resume examples by specialization and level
These four resume examples are shorter, but each one is complete. Pick the one closest to your field or level and compare it with the two above.
Junior healthcare data analyst resume (recent graduate)
This one fits a student applying for junior data analyst roles who has an internship or research job that involved real data.
Start your own resume from a template.
Summary
Statistics graduate with a public health minor (University of Minnesota, 2026) and a summer data analyst internship at a regional health system. Wrote SQL queries against Epic Clarity and built the Tableau no-show dashboard two clinic managers used to schedule reminder calls. Completed HIPAA privacy training and prepared de-identified extracts for a nurse-led research project.
Skills
Technical: SQL (SQL Server, Epic Clarity), R (tidyverse, ggplot2), Tableau, Excel
Healthcare data: appointment and encounter data, ICD-10 diagnosis codes, HIPAA Safe Harbor de-identification
Business: presenting to clinic managers, documenting report definitions
Education
B.S. Statistics, minor in Public Health | University of Minnesota | 2026
Relevant coursework: Biostatistics, Regression Analysis, Database Systems, Health Services Research
Experience
Data Analyst Intern | North Star Health, Minneapolis, MN | Jun 2025 – Aug 2025
- Wrote SQL queries against Epic Clarity to pull 18 months of appointment data for nine primary care clinics.
- Built a Tableau dashboard of no-show rates by clinic, weekday and appointment type; two clinic managers used it to focus reminder calls on the morning slots with the highest no-show rates.
- Prepared de-identified data extracts for a nurse-led research project using the HIPAA Safe Harbor method, and documented each step for the privacy office's review.
Student Research Assistant | University of Minnesota School of Public Health | Sep 2024 – May 2026
- Cleaned and merged public county-level vaccination and census data in R for a faculty study covering all 87 Minnesota counties.
Projects
Emergency Department Wait Times | R, Tableau | 2026
- Compared median emergency department wait times for Minnesota hospitals using public CMS Care Compare data and presented the results to the program's capstone panel.
- Education sits above experience. The degree and coursework are Aisha's strongest qualifications, so they come first. Once she has a year of analyst work, education moves to the bottom.
- The internship names the data system and the privacy method. Mentioning Epic Clarity and Safe Harbor de-identification tells a healthcare employer she has already worked with patient data under its rules.
Financial data analyst resume (four years)
This version fits analysts in banking, insurance or corporate finance whose work feeds budgets, forecasts or month-end reporting.
Start your own resume from a template.
Summary
Financial data analyst with four years in banking and insurance reporting, working in SQL Server, Power BI and Excel. Built the branch profitability report Piedmont Regional Bank's regional managers use to set targets, and automated a loan portfolio report that used to take two days.
Skills
Technical: SQL Server (T-SQL, stored procedures), Power BI (DAX, Power Query), Excel (Power Pivot, VBA), Python (pandas)
Finance: variance analysis, budget-versus-actual reporting, loan portfolio metrics, month-end close support
Business: presenting to finance leadership, documenting report logic for audit
Experience
Financial Data Analyst | Piedmont Regional Bank, Charlotte, NC | Mar 2024 – Present
- Built a branch profitability report in Power BI that combines general ledger, deposit and loan data for 42 branches; regional managers review it monthly to set branch targets.
- Automated the monthly loan portfolio report with T-SQL stored procedures and Power Query, cutting preparation from two days to three hours.
- Traced a recurring monthly variance in fee income to deposit fees posted to the wrong general ledger account; accounting corrected the mapping, and the variance has not returned.
- Documented the data sources and calculation logic behind six finance reports for internal audit's review of the reporting process.
Reporting Analyst | Carolina Mutual Insurance, Charlotte, NC | Jun 2022 – Feb 2024
- Produced weekly claims and premium reports from SQL Server and Excel for the finance team.
- Rebuilt the quarterly reserve summary as a single Power Pivot model, replacing 11 linked workbooks that often broke when one file moved.
Education
B.S. Finance, minor in Computer Science | University of North Carolina at Charlotte | 2022
- Finance terms appear in the bullets. General ledger, variance and month-end close show up in what Daniel did, so the skills list isn't the only evidence for them.
- The audit bullet shows controls. In banking and insurance, documented report logic matters almost as much as the report, so one bullet covers it.
Marketing data analyst resume (three years)
Start from this example if your analysis supports a marketing team: ad spend, campaigns, email tests or customer segments.
Start your own resume from a template.
Summary
Marketing data analyst with three years in e-commerce and retail marketing, working in SQL (BigQuery), GA4, Python and Looker Studio. Built the weekly channel performance report Brightleaf Home's paid media team uses to shift budget between search and social, and runs the readouts for email and landing-page A/B tests.
Skills
Technical: SQL (BigQuery), GA4, Python (pandas), Looker Studio, Excel (pivot tables, XLOOKUP)
Marketing analytics: channel attribution, A/B test readouts, customer segmentation, campaign ROI
Business: defining campaign KPIs with channel managers, presenting results to the marketing director
Experience
Marketing Data Analyst | Brightleaf Home, Atlanta, GA | Apr 2024 – Present
- Built a Looker Studio channel report from BigQuery ad-spend and GA4 order data; the paid media team reviews it every Monday and moved 15% of search budget to paid social after it showed a lower cost per order there.
- Read out 22 email and landing-page A/B tests with the CRM team using SQL and Python; a shorter subject line for the abandoned-cart email became the default after raising click-through from 3.1% to 3.6%.
- Segmented 180,000 customers by purchase recency and product category in Python for a reactivation campaign; lapsed bedding buyers ordered at more than twice the rate of an untargeted control group.
- Automated the weekly campaign ROI summary with scheduled BigQuery queries, replacing about four hours of spreadsheet work each Friday.
Marketing Coordinator | Peachtree Outfitters, Atlanta, GA | Jun 2022 – Mar 2024
- Pulled weekly email and social campaign results into Excel and reported open, click and conversion rates to the marketing manager.
- Built a pivot-table tracker of promo codes by channel that showed influencer codes drove about a third of first-time orders; the team doubled the influencer budget for the holiday season.
Education
B.B.A. Marketing, minor in Statistics | Georgia State University | 2022
Certifications
Google Analytics Certification — Google, 2025
- The coordinator job stays because it includes analysis. The promo-code tracker led to a budget decision, so it counts as analyst experience even without the title.
- Results use marketing's own measures. Cost per order, click-through and reactivation rate are the numbers a marketing director already reports, so they need no translation.
Analytics manager resume (ten years)
Choose this resume if you lead other analysts, set priorities with business leaders and still review or do analysis yourself.
Start your own resume from a template.
Summary
Analytics manager with ten years in e-commerce and retail analytics, the last three leading a team of five analysts at Tidewater Market. Runs the company's experimentation program and weekly KPI review, and introduced a request intake process that cut the open analytics backlog from about 60 requests to under 20. Works in SQL, Python, dbt and Tableau.
Skills
Technical: SQL (BigQuery, Snowflake), Python (pandas, statsmodels), dbt, Tableau, Looker
Methods: experiment design, demand forecasting, cohort and funnel analysis
Leadership: hiring and coaching analysts, prioritizing requests with business leaders, executive reporting
Experience
Analytics Manager | Tidewater Market, Seattle, WA | Jan 2023 – Present
- Lead a team of five analysts supporting marketing, product and operations; hired three of them and set up weekly reviews of SQL and dashboards before release.
- Run the experimentation program for checkout and search, with a standard design and readout template for more than 40 tests a year; a free-shipping threshold test led to a change worth an estimated $2.1M in annual gross margin.
- Introduced a request intake and quarterly prioritization process with product and marketing leads, reducing open analytics requests from about 60 to under 20.
- Present the weekly company KPI review to the executive team.
Senior Data Analyst | Tidewater Market, Seattle, WA | Apr 2020 – Dec 2022 (promoted)
- Built the first category-level demand forecast in Python, which merchandising used to plan seasonal inventory buys.
- Moved core sales reporting from spreadsheets to dbt models and Tableau dashboards used by 120 employees.
Data Analyst | Northline Outfitters, Portland, OR | Jul 2016 – Mar 2020
- Analyzed catalog and email campaign results in SQL and Excel and reported weekly response rates to the marketing team.
Education
B.A. Economics | University of Washington | 2016
- Team results come first, hands-on work second. Hiring, review processes and prioritization lead the current role. The forecast and dbt bullets from her senior analyst years show she still understands the analysis her team does.
- The backlog bullet is a manager's result. It measures a change Hannah made to how the team works, rather than taking credit for each analyst's findings.
How to write each section of a data analyst resume
Work through the sections in this order. Each step points back to the examples so you can see the advice applied.
Choose a format and length
Use reverse-chronological order, with your most recent job first. If you're changing careers or haven't held an analyst title, put Skills and Projects above Experience, as Marcus does. Avoid a skills-only (functional) format, because it hides where you actually used each tool.
Keep the resume to one page until you have more relevant analyst work than fits. Two pages are reasonable once you have several analyst roles with results worth keeping.
Use a single column with standard headings: Summary, Skills, Experience, Projects, Education and Certifications. Two-column layouts, tables, icons and skill-rating bars may not parse correctly in some applicant tracking systems. A rating bar also tells a hiring manager nothing they can check. Send a PDF unless the posting asks for a Word file, and give it a clear name such as Marcus-Bell-Data-Analyst-Resume.pdf.

Your contact information needs your name, city and state, email address, phone number and LinkedIn URL. Add a GitHub, Tableau Public or portfolio link if it shows work you'd be happy to discuss.
Write a short summary
A summary is two or three sentences under your contact details. It helps most when your background needs explaining, such as a career change or a first job after school, or when you have several years of results to point to.
Include the role you're targeting, your main tools, the domain you know and one specific result or piece of work. Leave out traits a reviewer can't check. A line such as "Detail-oriented, results-driven data analyst passionate about turning data into insights and seeking a challenging role" could describe anyone, so it gives the reviewer no reason to keep reading.
An objective states what you want from the job, while a summary states what you bring to it. Use a summary. If you're changing careers, the summary can name the move in its first sentence, as Marcus's does, which covers what an objective would have said.
These two summaries fit situations the resumes above don't cover.
Recent graduate without an analyst title
Mathematics graduate (B.S., Arizona State University, 2026) with SQL, Python and Tableau experience from coursework and a semester-long capstone with a local food bank. Built a Tableau dashboard of weekly pantry visits that the food bank's operations lead now uses to schedule volunteers.
BI reporting analyst in manufacturing
Business intelligence analyst with five years in manufacturing, working in SQL Server, Power BI and Excel. Built the plant scorecard 14 production managers review in daily stand-ups and moved 30 recurring spreadsheet reports into one shared reporting workspace.
List technical and business skills
Split your skills section into two groups. Technical skills are the tools and methods you would use on your first day. Business skills show that you can turn an analysis into a decision someone acts on.
Technical skills
- SQL: name the databases you've queried (PostgreSQL, MySQL, SQL Server, Snowflake, BigQuery). Add techniques such as window functions and CTEs if the posting asks for advanced SQL.
- Excel: pivot tables, XLOOKUP, Power Query and Power Pivot say more than "Excel" alone.
- Python or R: list the libraries you use, such as pandas and Matplotlib for Python, or tidyverse and ggplot2 for R. You don't need both programming languages.
- Tableau: calculated fields, level-of-detail expressions, and a Tableau Public link if you have published work.
- Power BI: DAX, Power Query and data modeling.
- Looker: LookML and explores. Looker Studio is a separate product, so name the one you've actually used.
- Statistics and methods: A/B testing, regression, forecasting and cohort analysis.
- Data modeling and version control: dbt and Git, if you've used them.
Business skills
- Turning a vague request into a question data can answer
- Defining metrics so different teams report the same numbers
- Presenting findings to people who don't work with data
- Gathering requirements for reports and dashboards
- Documenting data sources and definitions
- Domain knowledge, such as marketing attribution, revenue reporting or healthcare claims
SQL appears in many data analyst postings, so list it first unless the posting stresses something else. After SQL, the usual core is one BI tool (Tableau, Power BI or Looker), Excel, and Python or R.
Only list tools you could discuss in an interview. Soft skills such as communication and cross-functional collaboration are more convincing in a bullet than in a list: a line that shows you presenting to leadership says more than the phrase "stakeholder communication." For general advice on choosing and proving skills in any role, see this guide to resume skills.
Some analyst jobs center on gathering requirements, mapping processes and writing user stories rather than querying and reporting on data. If that describes your work, compare these business analyst resume examples, which also explain how the two roles differ. Postings titled business data analyst often mix both kinds of work, so match your bullets to whichever the posting lists first. If the postings you're reading ask mainly for machine learning models rather than reporting and dashboards, they are closer to data scientist roles, and your resume should lead with modeling work.
Show impact in your work experience bullets
Write each bullet as an action, the tool or method you used, and what changed as a result. For data analysts, the result usually falls into one of four types: a decision your analysis informed, a revenue or cost effect, hours saved by automation, or adoption of a dashboard or report.
Use real figures from your work, such as report totals, dashboard usage statistics or time spent before and after a change. If you can't get a number, describe the observable result instead: who adopted the report, or what decision it supported. Don't estimate a figure you couldn't explain in an interview. When the result came from a team effort, make your part clear.
| Type of impact | Weak bullet | Strong bullet |
|---|---|---|
| Decision informed | Responsible for analyzing survey data. | Analyzed 4,200 customer survey responses in R and showed that delivery delays drove most low scores; operations added a delay-notification email. |
| Revenue or cost effect | Worked on pricing analysis. | Modeled discount depth against margin in Excel for 300 products and recommended capping promotions at 20%, protecting about $75K in quarterly margin. |
| Hours saved by automation | Automated reports using Python. | Wrote a Python script that merges three vendor files into one cleaned table, replacing a two-hour manual task every Monday. |
| Dashboard adoption | Created dashboards for the buying team. | Built a Tableau inventory dashboard that 14 buyers check daily instead of requesting weekly spreadsheet exports. |
Here are more bullets grouped by the type of result. Pick the group that matches what you can honestly show, then swap in your own tools, data and outcome.
Decisions informed
- Analyzed 18 months of support tickets in SQL and presented the top five refund drivers to product leadership; two fixes were added to the next quarter's roadmap.
- Compared on-time delivery for three carriers in Python and recommended moving Midwest orders to the most reliable one; operations made the switch the following month.
- Forecasted holiday order volume by store from three years of sales data in Excel; the regional director used the forecast to set seasonal staffing for 32 stores.
Revenue or cost effect
- Matched invoice and payment records in SQL and found $240K in duplicate vendor payments, of which finance recovered $190K within two quarters.
- Segmented lapsed customers by purchase history in Python and sized a win-back email campaign that returned $1.2M in revenue on a $90K budget.
- Found that 11% of free-trial accounts never connected a data source; the onboarding change that followed raised trial-to-paid conversion from 14% to 17%.
Hours saved by automation
- Replaced a manual weekly sales reconciliation with a scheduled SQL job and Python script, saving the finance team about six hours a week.
- Moved 12 Power BI reports to scheduled dataflow refreshes, ending the Monday-morning manual export.
- Cut monthly close preparation from two days to four hours by building reusable Power Query steps that clean vendor files.
Dashboard adoption
- Launched a Tableau sales dashboard that 85 of 90 account managers opened weekly within two months, replacing four emailed spreadsheets.
- Built a Looker explore for the marketing team and trained 12 marketers to use it; ad hoc data requests to analytics dropped by about half.
- Rebuilt a slow executive dashboard by moving calculations into SQL views, cutting load time from 40 seconds to 5; weekly viewers grew from 6 to 25.
Data quality and accuracy
Use this group if much of your work is validating or reconciling data. The result is the error you caught or the reports that now agree.
- Wrote SQL validation checks for the nightly load into the customer table, catching about 3,000 duplicate records in the first month before they reached finance's monthly reports.
- Traced a 7% gap between CRM and billing customer counts to a time-zone cutoff in the ETL job; after engineering fixed it, the two reports matched within 0.2%.
If you're applying in a particular industry, use the measures that industry already tracks. These bullets show what that looks like in five common settings.
Marketing
- Analyzed GA4 checkout funnels by device and found mobile abandonment at the payment step was nearly twice the desktop rate; the payment-page redesign that followed raised mobile conversion from 1.9% to 2.4%.
- Measured a loyalty email series against a 10% holdout group in SQL and showed a 6% lift in repeat purchases, so marketing kept the series and extended it to two more regions.
Finance
- Replaced the hand-assembled monthly budget pack with a budget-versus-actual report for 14 cost centers, fed directly from the general ledger.
- Created a 13-week cash forecast in Python from receivables aging and customer payment history; treasury uses it to time draws on the company's credit line.
Healthcare
- Reported 30-day readmissions by discharge unit with SQL queries against Epic Clarity; the quality committee used the report to start follow-up calls on the two units with the highest rates.
- Checked quarterly quality-measure calculations in SAS against payer reports and documented five logic differences, which the reporting team corrected before submission.
Operations
- Matched hourly call volume against agent schedules in Excel; the contact center moved six agents to evening shifts and average wait time fell from four minutes to 90 seconds.
- Mapped delivery times from GPS logs in SQL and Tableau and showed that three routes accounted for most late deliveries; after dispatch rebalanced them, on-time delivery rose from 87% to 93%.
HR and people analytics
- Studied two years of HRIS and exit-survey data in R and found first-year turnover concentrated at three warehouse sites; HR added a 90-day check-in for new hires at those sites.
- Set up a time-to-fill dashboard that nine recruiters use in weekly hiring reviews, replacing a manually updated tracker.
Use action verbs and the posting's keywords
Start each bullet with a verb that names what you did, and vary the verbs so the section doesn't read as one sentence repeated. These verbs fit the main parts of analysis work:
- Getting and preparing data: extracted, queried, joined, cleaned, validated, reconciled
- Analyzing: analyzed, segmented, modeled, forecasted, tested, identified
- Building: built, automated, designed, defined, documented
- Sharing results: presented, recommended, trained, reported
Use the posting's own terms wherever they describe your work truthfully. If it says "data visualization" or "self-service dashboards," those phrases should appear in your skills or bullets, not only a synonym. Spell out an acronym once, such as "extract, transform, load (ETL)," because a reviewer may search for either form.
For example, a posting that asks for "self-service dashboards" could turn this bullet:
- Before: Built dashboards in Tableau for the sales team.
- After: Built self-service Tableau dashboards that let 14 sales managers filter pipeline data themselves instead of requesting weekly exports.
Add a projects section if you don't have an analyst title
Projects are your evidence when no job title says "analyst." Any of these count: coursework, a certificate capstone, public datasets such as city open data or Kaggle, volunteer analysis for a nonprofit, or analysis you've done inside a non-analyst job.
For each project, include:
- A short name, the tools and the year, plus a link to the dashboard, notebook or repository.
- The question you set out to answer.
- The data you used: its source and roughly how large it was.
- What you did with it: cleaning, joining, modeling or visualizing.
- What came out of it: a finding, a recommendation or a published dashboard.
Marcus's retail segmentation project follows this pattern in four bullets. Here are three more entries, each built on a different kind of data.
Public open data: Chicago Food Inspection Results | Python (pandas), Tableau | 2026
- Asked which types of food businesses fail city health inspections most often, and in which community areas.
- Used the City of Chicago's public food inspection records from 2018 onward.
- Standardized inconsistent facility types, joined inspections to community areas and calculated failure rates for each.
- Published a Tableau Public dashboard with failure rates by facility type and area and a filter for repeat failures: public.tableau.com/app/profile/jordan.lee
Volunteer analysis: Adoption Times at Riverside Animal Shelter | Excel | 2025
- Asked, at the volunteer coordinator's request, which listing details were linked to faster adoptions.
- Combined three years of adoption records, about 2,100 animals, with the shelter's online listing history.
- Compared median days to adoption for listings with and without photos, age details and behavior notes.
- Presented a one-page summary to the shelter director; the shelter now requires two photos and a behavior note on every listing.
Modeling project: Hotel Booking Cancellations | SQL (PostgreSQL), Python (scikit-learn) | 2025
- Asked which booking details predict a cancellation and how a hotel could use them to set deposit rules.
- Loaded a public dataset of about 119,000 hotel bookings into PostgreSQL and checked it for missing and duplicate rows.
- Built a logistic regression model in Python and compared it with a decision tree on held-out data.
- Wrote a two-page recommendation on which bookings should require a deposit, based on the model's strongest predictors: github.com/jordanlee/hotel-cancellations
The shelter project has no link because the data belongs to the shelter. When you can't publish the work, describe it fully and offer to walk through it in an interview.
Check that every link opens and that each repository has a README explaining the question and how to run the analysis. Once you have analyst work experience, keep only the one or two projects that still add something.
List education and certifications
For education, list the degree, school and graduation year. Recent graduates can add relevant coursework, such as statistics, databases or econometrics, as Aisha does, and a GPA if it's strong. Experienced analysts need only the degree line, as in Elena's resume.
List each certification on its own line with the issuer and the year, for example:
- Google Data Analytics Professional Certificate — Coursera, 2025
- Microsoft Certified: Power BI Data Analyst Associate (PL-300) — Microsoft, 2024
The Google certificate is an entry-level program covering spreadsheets, SQL and visualization, so it's most useful for career changers who need to show structured training. The Microsoft certification, earned by passing exam PL-300, carries most weight when a posting names Power BI. Check each issuer's current syllabus and renewal rules, and list the certification's status as it stands when you apply. A certificate supports your application best when a project or bullet shows you using the same tools.
Tailor your resume to the job posting's tools
Tailoring means making the tools and tasks the posting asks for easy to find on your resume, without adding anything you haven't used.
Here's a fictional posting for a Data Analyst, Growth role:
- Write advanced SQL against our Snowflake warehouse
- Build and maintain Looker dashboards for product teams
- Design and analyze A/B tests with product managers
To tailor a resume for it:
- Highlight the tools and tasks the posting names, and mark the three to five that appear first or most often.
- Reorder your skills so those tools come first, using the posting's names for them (Looker, not "BI tools").
- Move the bullets that show those tasks to the top of each role.
- Swap the result in your summary for the one closest to the job.
- Leave out tools you haven't used. If the posting wants Power BI and you know Tableau, list Tableau and point to a dashboard you built; you can say in your cover letter that the concepts carry over.
Here's how Elena's resume would change for this posting.
| Resume part | General version | Tailored version |
|---|---|---|
| Technical skills order | SQL (Snowflake, PostgreSQL), Python, dbt, Looker (LookML), Power BI (DAX), Excel, Git | Looker (LookML), SQL (Snowflake, PostgreSQL), Python, dbt, Excel, Git, Power BI (DAX) |
| Methods order | Cohort analysis, A/B test design and readout, forecasting, regression | A/B test design and readout, cohort analysis, regression, forecasting |
| Summary result | Built the churn-risk dashboard customer success uses to plan renewals. | Set up the readout process for pricing-page A/B tests and analyzed trial sign-up funnels with product managers. |
| First bullet in current role | Defined 14 core revenue and retention metrics in dbt | Set up the readout process for pricing-page A/B tests (moved up from third) |
Nothing new was added. The same experience was reordered so the hiring manager sees the posting's three requirements in the first half of the page.
Keep a master resume with every role, project and result, then copy and trim it for each application. For more on reading a posting for the skills and keywords it stresses, see this guide to tailoring your resume to a job description.



Tailor your resume automatically
Common data analyst resume mistakes
- Listing tools without showing where you used them. A skills list says you know Python; a bullet shows what you did with it.
- Listing every tool you've ever opened. Every item is fair game in an interview, so keep only what you can discuss.
- Writing duties instead of results. "Responsible for weekly reports" tells the hiring manager what the job was, not what you achieved in it.
- Using vague labels. Replace "data analysis" or "data mining" in your skills list with methods such as regression, cohort analysis or forecasting.
- Claiming a team's result as yours alone, or inventing numbers. Describe your part and use figures you can explain.
- Using internal names reviewers won't know. "Built the HAWK report" means nothing outside your company; say what the report measured and who used it.
- Broken links. Open every portfolio, GitHub and Tableau Public link before you apply.
- Sending the same resume to every posting. Reorder skills and bullets for each job's tools, as shown above.
- Typos in your contact details. A wrong digit in your phone number or email means a recruiter can't reach you.